Performance Testing, like many other phrases associated with software testing, can mean different things to different people. Some use the term to include all types of tests that measure an application’s behavior, including load and stress testing. Others use the term to mean the general responsiveness of an application under ordinary conditions. I will be using the latter definition in today’s post.
Performance Testing measures how an application behaves when it is used.
This includes reliability:
- Does the page load when a user navigates to it?
- Does the user get a response when they make a request?
and speed:
- How fast does the page load?
- How fast does the user get a response to their request?
Depending on the size of the company you work for, you may have performance engineers or DevOps professionals who are already monitoring for metrics like these. But if you work for a small company, or if you simply like to be thorough in your testing, it’s worth learning how to capture some of this data to find out how well your application is behaving in the real world. I know I have stopped using an application simply because the response time was too slow. You don’t want your end users to do that with your application!
Here are five different ways that you can monitor the health of your application:
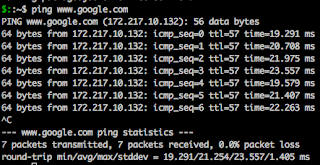
Latency– this is the time that it takes for a request to reach a server and return a response. The simplest way to test this is with a ping test. You can run a ping test from the command line on your laptop, simply by entering the word ping, followed by a website’s URL or an IP address. For example, you could run this command
ping www.google.com
And get a response something like this:
(To stop a ping test, simply use CTRL-C)
Let’s take a look at the response times. Each ping result shows how long it took in milliseconds to reach that server and return a response. At the bottom of the test results, we can see the minimum response time, the average response time, the maximum response time, and the standard deviation in the response time. In this particular example, the slowest response time was 23.557 milliseconds.
API Response Time- this is a really helpful measurement, because so many web and mobile applications are using APIs to request and post data.
Postman (my favorite tool for API testing) has response time measurements built right into the application. When you run a request, you will see a Time entry right next to the Status of the response:
Here we can see that the GET request I ran took 130 milliseconds to return a response. You can include an assertion in your Postman tests which will verify that your response was returned in less than a selected time, such as 200 milliseconds. The assertion will look like this:
pm.test(“Response time is less than 200ms”, function () {
pm.expect(pm.response.responseTime).to.be.below(200);
});
(If you would like to learn more about API testing with Postman, I have several blog posts on this topic.)
Another great tool for testing API response time is
Runscope. It is easy to use, and while it does not offer a free version, it has a very helpful feature: you can make API requests from locations all over the world, and verify that your response times are good no matter where your users are. You can easily set up automated checks to run every hour or every day to make sure that your API is up and running. Runscope also offers real-time monitoring of your APIs, so if your application suddenly starts returning 500 errors for some users, you will be alerted.
Web Response Time- Even if your API is responding beautifully, you’ll also want to make sure that your web page is loading well. There’s nothing more frustrating to a user than sitting around waiting for a page to load! There are a number of free tools that you can use to measure how long it takes your application’s pages to render. With
Pingdom, you can enter your website’s URL and it will crawl through your application, measuring load times. Here are the results I got when I used my website’s URL and requested that it be tested from Melbourne, Australia:
Pingdom also provided suggestions for improving my site’s performance, such as adding browser caching and minimizing redirects. Paid customers can also set up monitoring and alerting, so you can be notified if your page loading times slow down.
Mobile Application Monitoring- If you have a native mobile application, you’ll want to make sure that it’s responding correctly and quickly. Crashlytics is free software that can be added to your app to provide statistics about why your app crashed. New Relic offers paid mobile monitoring for your app, allowing you to see data about which mobile devices are working well with your app and which might be having problems.
Application Performance Monitoring (APM) Tools- For more advanced monitoring of your application, you can use an APM tool such as ElasticSearch or Sharepath. These tools track every single transaction your application processes and can provide insights on CPU usage, server response times, and request errors.
Whether you work for a big company with a web application that has millions of users, or a small startup with one little mobile app, performance testing is important. It may mean the difference between happy customers who keep using your application, and disaffected users who uninstall it.


Hello friends, nice post and nice urging commented at this place, I am in fact enjoying by these.
Thanks a lot, this post helps a lot making some high-level architectural decision. Thanks for the information.
software testing services
software testing companies
Regression testing services
Performance testing Services
Test automation services