The modern software development team is beginning to blur the traditional lines between developer and tester. This means that developers are starting to get more involved with writing test automation at all levels of the pyramid, and it also means that testers are starting to get more involved with the inner workings of an application. Wouldn’t it be great if you were able to find the causes of JavaScript bugs rather than just reporting on them? Using breakpoints in Chrome’s Dev Tools is a great way to do this!
In this post, I’ll be leading you through a hands-on tutorial on using Chrome Dev Tools for debugging. I learned this information from this helpful Google blog post, but I’m using an example application so you can try the various breakpoint methods yourself.
It’s important to note that in order to use these breakpoints, you’ll need to have your application installed locally. You can’t just go to a deployed version of your company’s application and debug it. This post shows you how to run a sample React application locally; you can work with your developers to get your team’s application running locally as well.
Getting Started
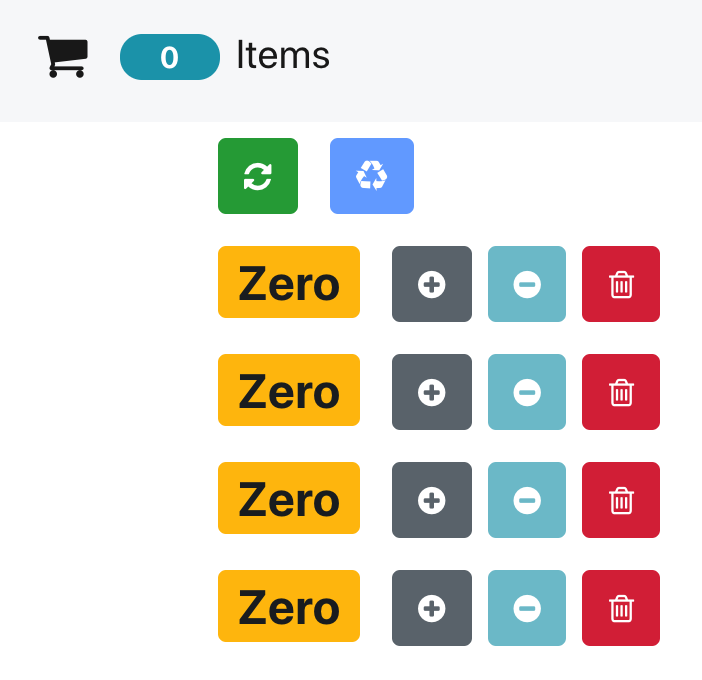
To follow along with this post, you’ll need to have Node.js and Git installed. Then you’ll need to clone this repository. If you’ve never cloned a repository before, you can find instructions here. This repo is a very simple counter application that could be used for something like adding items to a shopping cart. It doesn’t do much, but it does enough that we’ll be able to try out some breakpoints with it.
Once you’ve cloned the repository, then you’ll need to do the following:
cd counter-app This moves you to the application folder.
npm install This gets all the packages needed to run the application and builds it.
npm start This starts the application.
You should see the application open up in your Chrome browser. It will look like this:
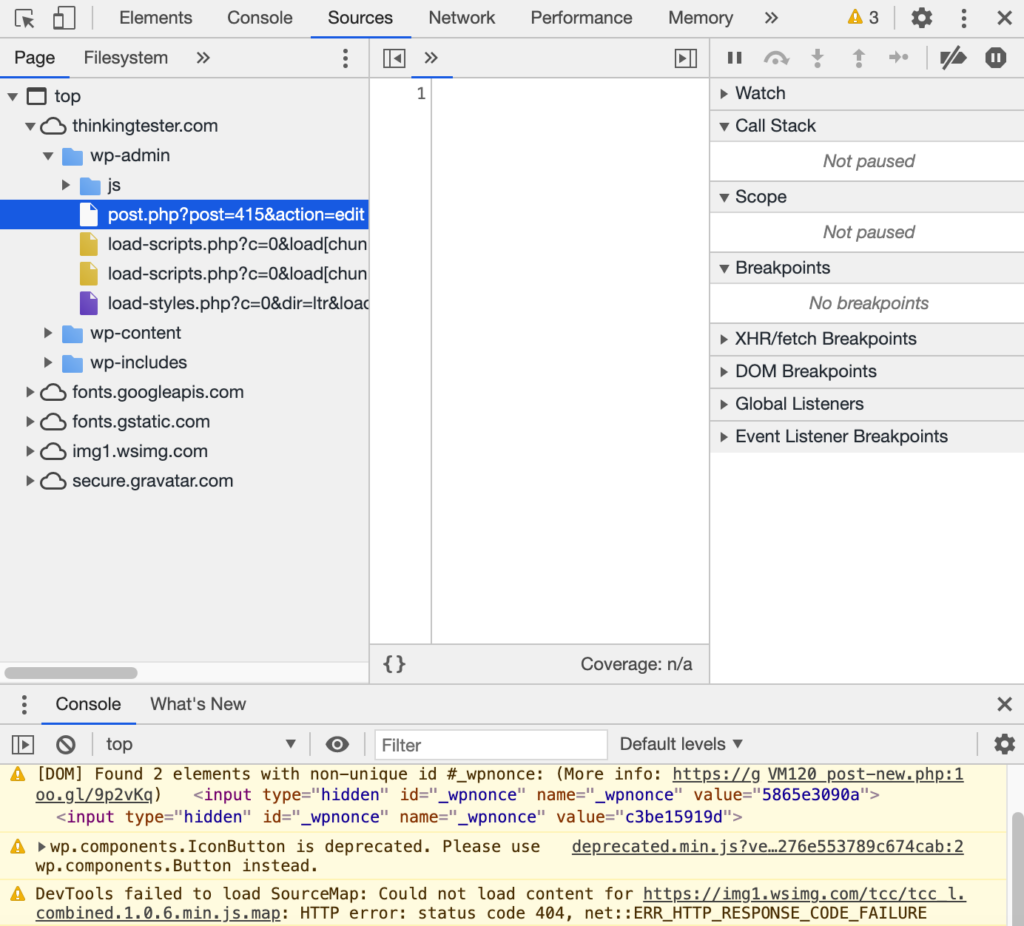
Next you’ll need to open up Dev Tools. You can do this by using the three-dot menu in the upper-right corner of the Chrome browser. From that menu, choose “More Tools”, and then “Developer Tools”. The Dev Tools will open at the side of the browser, and will look something like this:
We are now nearly ready to begin! With each type of breakpoint, we’re going to set it, watch it work, press the “Resume script execution” button, then clear the breakpoint. The “Resume script execution” button is found at the top of the right-most panel, and looks like this:

To clear a breakpoint, simply right-click on it, and choose “Remove breakpoint”. Let’s get started!
Line of Code Breakpoint
The line of code breakpoint is the most commonly used breakpoint. When the application code is executing and it arrives at this line, the code execution will pause. You can use this pause to analyze the current state of the application, from what is visible to what the variable values are.
If the “Sources” tab is not already selected at the top of the Dev Tools pane, select it now. Then look in the left section of Dev Tools to find the src folder, and inside that folder, click on the App.js file. The App.js file will open up in the center pane of Dev Tools.
Now find line 17, and click on the line number. The number will be highlighted with a blue arrow like this:
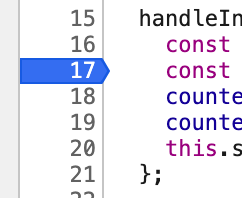
This line of code is in the handleIncrement function, which is the function that is called when you press one of the plus (+) buttons in the application. Press a plus button now. You should see Line 17 highlighted, and a message in the rightmost pane that says “Paused on breakpoint”. While you are paused, you can look at the Call Stack and Scope sections to learn more about what’s happening in the application at this moment.
Don’t forget to remove the breakpoint on line 17, and click the Resume button before going on to the next section!
Conditional Line of Code Breakpoint
Now let’s try out a conditional line of code breakpoint. This is a breakpoint that only executes if a certain parameter has been met. Right-click on line 19 of the App.js code, and choose “Add conditional breakpoint”. A breakpoint will be added, and there will be a little popup window where you can add your condition. Add this condition: index === 0 and click the Return or Enter key.
Now that the conditional breakpoint has been set, let’s see it in action. If you haven’t clicked any other buttons since the previous exercise, you should have a counter that is currently set to 1. Click the plus button again. The code execution won’t stop at the breakpoint, because the counter is currently set to 1. Click the minus button (–) to return the counter to Zero. Now click the plus button again. This time the code execution will stop at the breakpoint, because the current condition of the counter at line 19 is Zero.
Don’t forget to remove the breakpoint on line 19, and click the Resume button before going on to the next section!
DOM Breakpoint
It’s also possible to set a breakpoint directly in the DOM. To do this, we’ll first click on the Elements tab in the top bar of Dev Tools. Change the topmost counter from 1 back to Zero. Now right-click on that Zero counter and choose “Inspect”. The center pane of Dev Tools will navigate to and highlight the section of the DOM where this counter exists. Right-click on that highlighted section and choose “Break on” and then “Attribute modifications”. When this counter moves from Zero to 1, it changes attributes (namely, the color), so by selecting “Attribute Modifications” we are telling the code to stop whenever the attribute of this icon is about to change.
Click the plus button and you’ll see the execution stop at the breakpoint, because the color of the counter is about to change from yellow to blue. Click the “Resume execution” button and you’ll see the code execute and the counter change to 1 (and turn blue). Click the plus button again, and the execution won’t stop at the breakpoint, because when going from 1 to 2, the color doesn’t change. But if you click the minus button twice to go back to Zero, you’ll see the code execution pause at the breakpoint again, because the color of the counter is about to change from blue to yellow.
Don’t forget to remove the breakpoint and click the Resume button when you are done with this section!
This is becoming quite a long post, and we’ve got four more breakpoints to learn about! So I’m going to stop here and continue next week. Until next time!
Pingback: Five Blogs – 21 September 2020 – 5blogs
Pingback: How to Use Breakpoints in Dev Tools- Part II – Think Like a Tester